
- Abstract
This chapter outlines the scale and nature of the global road trauma burden. There is significant discrepancy in how road trauma is experienced across the world, with low- and middle-income countries experiencing higher fatality rates than high-income countries. More than 90% of all road fatalities occur in low-income and middle-income countries, despite having only 48% of the world’s registered vehicles. This chapter provides information on variation in road trauma rates according to factors such as socio-demographics, regional location, and country income levels and describes the relative contribution of road crashes to the global burden of injury. It also discusses a range of factors contributing to the global road trauma crisis, including those particularly relevant to the low- and middle-income country context, such as urbanisation, rapid rates of motorisation, vehicle importation, and the increasing prevalence of powered two- and three-wheeled vehicles. The chapter concludes with discussion on road safety as a global development issue and some contemporary challenges to improving road safety outcomes.
- Introduction
Together with the preceding chapter on the History of Road Safety, this chapter is designed to provide a foundation for the Body of Knowledge (BoK). This chapter outlines the scale and nature of the global road trauma burden and discusses the impact of that burden across a variety of socio-demographic, regional, road use, and country income level categories, drawing primarily on data produced in the series of global status reports on road safety. It describes the relative contribution of road crashes to the global trauma burden of injury and provides information to compare the road trauma burden with harm caused by other disasters and hazards. This chapter also provides information on contemporary road safety challenges, including some that are particularly relevant to the low- and middle-income (LMIC) country context.
- Scale and nature of the road safety problem
As described in the preceding chapter, the immense scale of the global road trauma burden started to gain attention throughout the 1990s, and international organisations drew attention to the problem through a series of publications and actions. The World Report on Road Traffic Injury Prevention (WHO, 2004) reported that:
“road traffic injuries are a major but neglected global public health problem, requiring concerted efforts for effective and sustainable prevention. Of all the systems that people have to deal with on a daily basis, road transport is the most complex and the most dangerous. Worldwide, the number of people killed in road traffic crashes each year is estimated at almost 1.2 million, while the number injured could be as high as 50 million – the combined population of five of the world’s large cities. The tragedy behind these figures regularly attracts less media attention than other, less frequent but more unusual types of tragedy. What is worse, without increased efforts and new initiatives, the total number of road traffic deaths worldwide and injuries is forecast to rise by some 65% between 2000 and 2020, and in low-income and middle-income countries deaths are expected to increase by as much as 80%”. (p.3).
Since then, the trend in road traffic fatalities continued to rise to an estimated 1.35 million fatalities in 2016, and then a decline over time. It is important to note that accurate country-specific data are difficult to obtain for a variety of reasons. Despite this difficulty, a series of status reports published by the World Health Organisation since 2009 documents changes in fatalities, injuries, and road safety-related legislation and provides a snapshot of individual country performance over time. More information about data trends for regions and individual countries and can be found from the WHO Road Safety Data application that is freely available from https://www.who.int/teams/social-determinants-of-health/safety-and-mobility/global-status-report-on-road-safety-2023 (Figure 1).
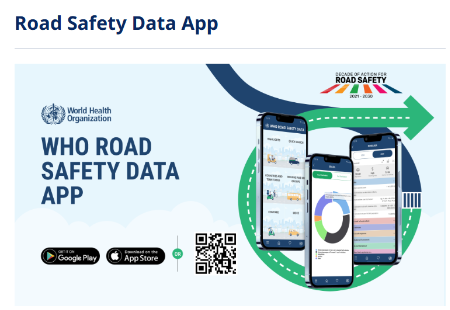
Source: https://www.who.int/teams/social-determinants-of-health/safety-and-mobility/global-status-report-on-road-safety-2023
The 2009 Global Status Report provided ‘baseline’ information from 178 countries using data collected via a 2008 survey and the overall findings were:
- annually, more than 1.2 million people die each year on the world’s roads, with between 20 and 50 million more suffering non-fatal injuries;
- in most regions of the world, road traffic injuries are increasing;
- low-income and middle-income countries have higher road traffic fatality rates (21.5 and 19.5 per 100 000 population, respectively) than high-income countries (10.3 per 100 000); and
- more than 90% of global road fatalities occur in low-income and middle-income countries, which have only 48% of the world’s registered vehicles.
The most recent global status report (2023) used data collected in 2021 and confirmed that road crashes remain an acute problem in LMICs, still accounting for more than 90% of all fatalities worldwide. The 2023 report noted that global road traffic deaths had decreased slightly since publication of the previous report (2018), from 1.25 million to 1.19 million people per year. Apart from this immense human cost, the report noted that road crashes cost most countries 3% of gross domestic product. The 2023 report also provided updated information across a range of socio-demographic and road use indicators, as summarised below.
Road user type:
The group representing the highest proportion of all global road fatalities was 4-wheel vehicle occupants at 30%, followed by pedestrians (23%), powered two- and three-wheeler users (21%), and cyclists (6%). The remaining 20% of fatalities represented occupants of vehicles carrying more than 10 people, heavy goods vehicles, and ‘other’ users (including powered personal micromobility options such as e-scooters) and ‘unknown’ user types.
Socioeconomic status:
More than 90% of road traffic deaths occurred in LMICs. Road traffic death rates were highest in the WHO African Region and lowest in the European Region. Even within HICs, people from lower socioeconomic backgrounds were more likely to be involved in road traffic crashes.
Age and Sex:
Road traffic injuries were the leading cause of death for children and young adults aged 5–29 years and the 12th leading cause of death when all ages were considered. Two thirds of road traffic fatalities occurred among people of working age (18–59 years), and 19% occurred in people aged 60+ years. In addition, males are disproportionately impacted and are typically three times more likely to be killed in road crashes than females.
Country income level differences and regional differences:
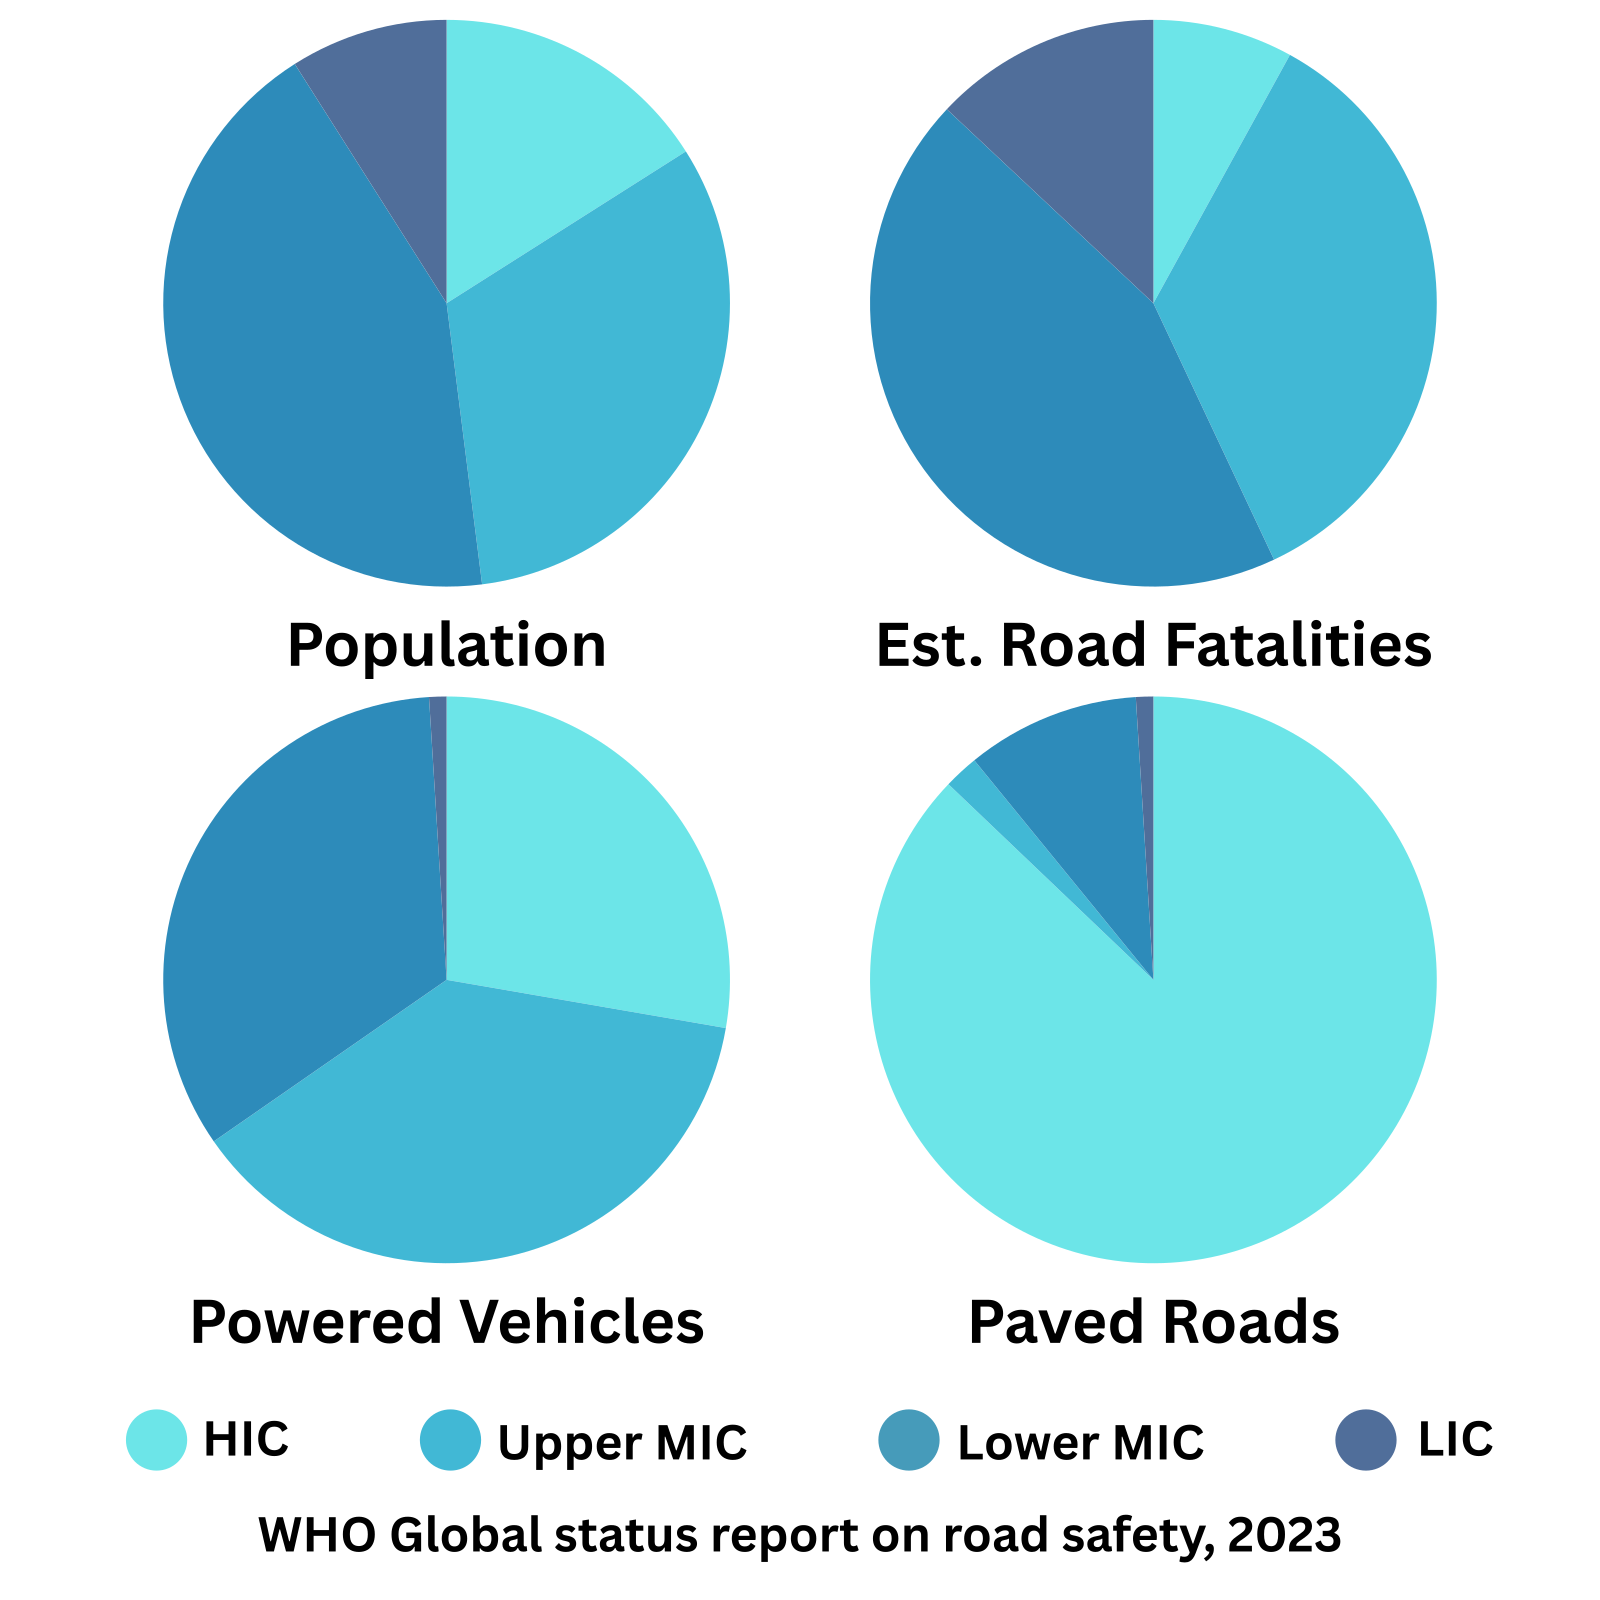
There is great disparity in road fatalities across geographic regions and country income levels. The majority of fatalities (92%) occur in upper-middle, lower-middle, and low-income countries combined. Relative to the size of the vehicle fleet and road network, a disproportionately high number of fatalities occur in low-income countries (13% of global road fatalities), compared to high-income countries (8%). Figure 2 demonstrates these discrepancies across country income levels relative to population, paved inter-urban roads and registered vehicles.
Using WHO regional categories, the discrepancy across regions is clear from the figures shown below, with the South-East Asia region recording the highest absolute number and proportion of fatalities:
- South-East Asia Region: 330 222 deaths; 28% of global burden
- Western Pacific Region: 297 733 deaths; 25% of global burden
- African Region: 225 482 deaths; 19% of global burden
- Region of the Americas: 144 090 deaths; 12% of global burden
- Eastern Mediterranean Region: 125 781 deaths; 11% of global burden), and
- European Region: 62 670 deaths; 5% of global burden.
Since 2010, most regions have experienced reductions in road fatalities. However, the African region is the exception to this trend, with a 17% increase in the number of deaths since 2010 (WHO, 2023).
Future projections
The global community has adopted an ambitious target – to prevent at least 50% of road traffic deaths and injuries by 2030. This is the target outlined in the Global Plan for the Second Decade of Action for Road Safety 2021-2030. Meeting that ambitious target requires urgent and concerted action. As mentioned earlier, the 2023 Global Status Report noted that road traffic injuries were estimated to be the 8th leading cause of death when all age groups were considered and are predicted to become the seventh leading cause of death by 2030 (Global Health Observatory, World Health Organization). Together, this projection and the ambitious global target (50% reduction by 2030) highlights the critical need for action.
Relative contribution of road crashes to global trauma and burden of injury
The impact of road trauma is considerable, when compared with other causes of death and injury. The information below provides context for comparison across other forms of harm. Data contained in the 2021 Global Burden of Disease study, published by the Institute for Health Metrics and Evaluation, reports trends in the leading causes of disease burden (i.e., the cumulative impact of loss of healthy life due to illness, injury, and dying prematurely) and projections of the future burden to 2050. In 2010, road traffic injuries were the 6th leading cause, after neonatal disorders, ischemic heart disease, stroke, lower respiratory infections and diarrheal diseases. In 2020, road traffic injuries were listed as the 9th leading cause of disease burden worldwide, after neonatal disorders, ischemic heart disease, stroke, COVID-19, lower respiratory infections, chronic obstructive pulmonary disease, diabetes, lower back pain and diarrheal diseases.
In 2021, COVID-19 had shifted to first ranking position, followed by ischemic heart disease, neonatal disorders, stroke, lower respiratory infections, chronic obstructive pulmonary disease, diabetes, other COVID outcomes, lower back pain, with road traffic injuries at position 10 (Institute for Health Metrics and Evaluation, 2024, see Figure 3).
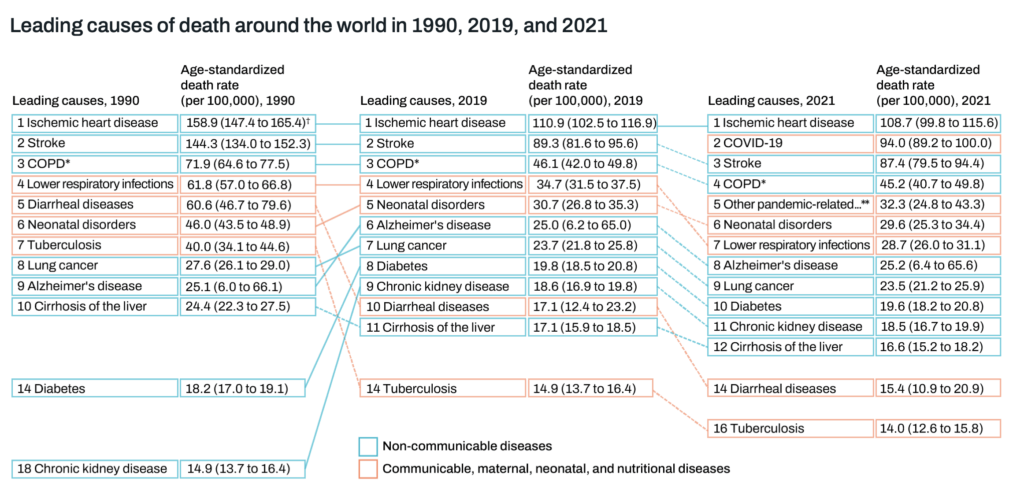
By 2022, road injuries were ranked at position 9 (one position higher than the previous year) after ischemic heart disease, neonatal disorders, stroke, lower respiratory infections, diabetes, chronic obstructive pulmonary disease, COVID-19, and lower back pain. The projection for 2050 is that road injuries will have fallen to the 13th leading cause of the global disease burden.
Comparison with other disasters
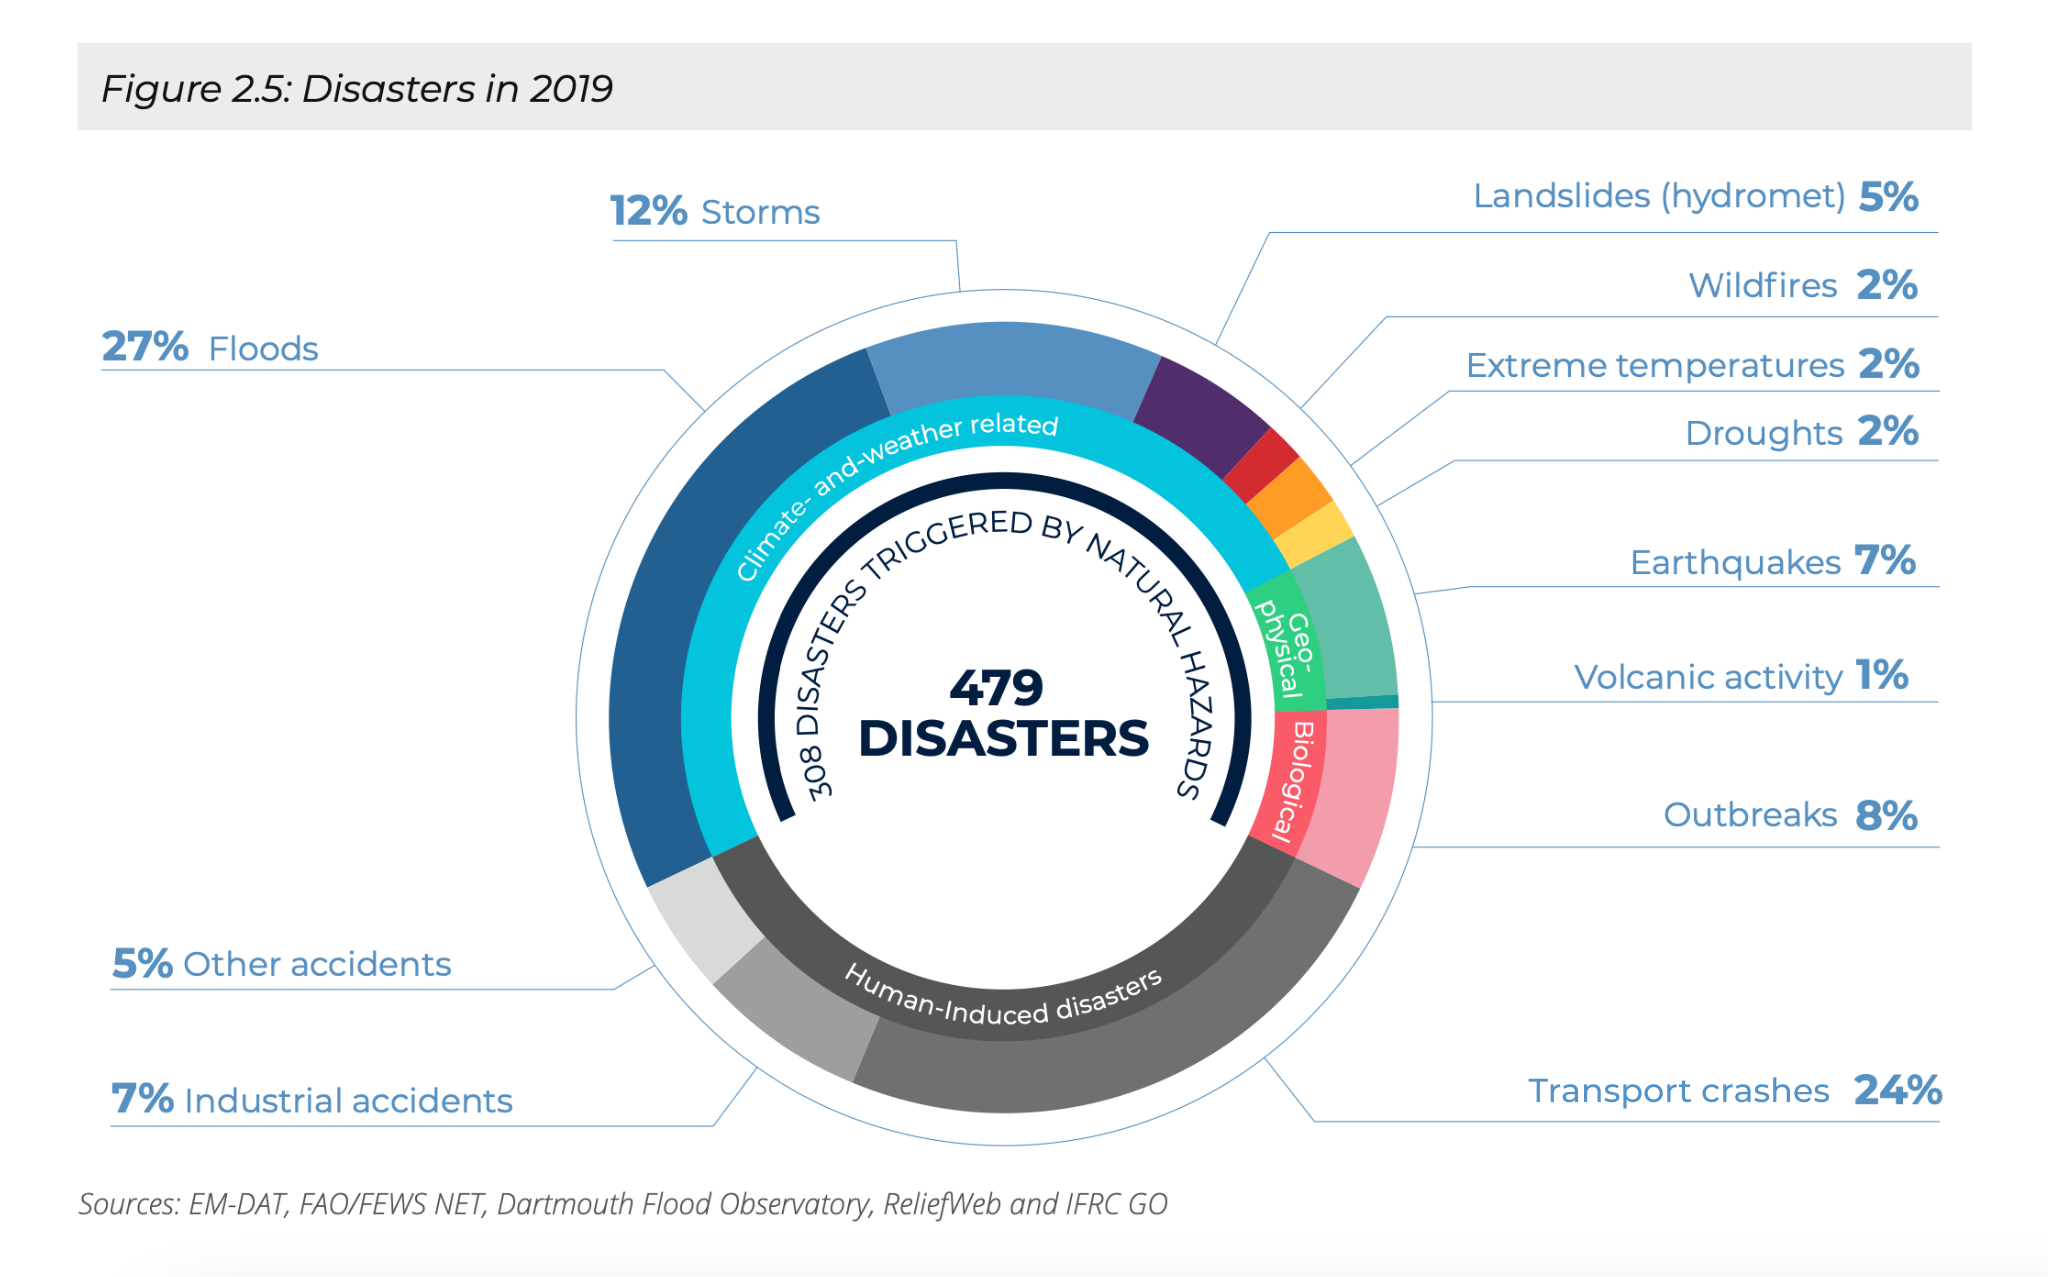
The scale of the health burden from transportation-related incidents is significant, especially when compared with harm caused by other disasters and hazards (e.g., climate and weather, geophysical, and biological). The most recent World Disasters report to include transport-related disasters and hazards showed the scale of the burden. Transportation incidents (air, boat, train and road) represented the second largest proportion (24%) of disasters and hazards globally, after flooding (27%) (International Federation of Red Cross and Red Crescent Societies, 2020; see Figure 4). It is acknowledged that road-related incidents are not the only transportation mode represented in the ‘transport accidents’ category in the human-induced disasters contained in the 2020 report. However, the scale of the harm associated with motorised human movement is significant.
A wide variety of factors contribute to road safety outcomes and are discussed throughout the chapters in this BoK. Several key factors are discussed below, particularly as they relate to the discrepancy in road trauma rates across high-, middle-, and low-income countries.
Urbanisation has significantly contributed to the way we live, work, and move. More people are becoming city dwellers each year. It is estimated that by the 2050s, 2.5 billion people will be added to current city populations across the world, with most of this urbanisation occurring in Asia and Africa (WRI Ross Center for Sustainable Cities, 2024). This shift in the human landscape also brings changes and challenges to other aspects of society including employment, health care, education, social welfare, social mobility and transportation, as well as related increases in noise, light and air pollution. Increasingly dense urban spaces, with the legacy of car-centric design, provide challenges to creating urban spaces that are conducive to safe and equitable mobility options (Global Designing Cities Initiative, 2016; International Transport Forum, 2020).
Rapidly increasing rates of motorisation, particularly in LMICs, is another contributing factor that makes road safety improvements challenging. Increased personal vehicle ownership brings greater personal mobility with increased access to services, recreation, employment, health care and general freedom of movement, but can also be accompanied by increased traffic congestion, pollution and exposure to road crashes. Gorham et al. (2022) provided a comprehensive discussion of the key development and safety issues relating to increasing motorisation rates, noting two major issues of concern with increasing demand of vehicle stock in LMICs: 1) the importation of second-hand vehicles that are often of substandard quality, and 2) the proliferation of ownership and use of powered two-wheelers (PTWs) which includes motorcycles, mopeds, scooters, and electric bikes (also known as e-bikes).
Vehicle importation laws and policies influence the overall makeup of the vehicle fleet in every country. Between 2015-2018, the European Union, Japan, and the United States of America were the largest exporters of used light duty vehicles, representing 99% of all exports. The majority (70%) of these second-hand vehicles were exported to LMICs, with Africa importing the largest proportion (40%), followed by Eastern Europe (24%), Asia-Pacific (15%), the Middle East (12%) and Latin America (9%) (United Nations Environment Programme, 2020). In many countries, a lack of regulation on imported vehicles, and limited or lack of vehicle safety standards, means that imported used vehicles create additional challenges to improving road safety outcomes and to controlling vehicle-related pollution and associated impacts on air quality (Gorham et al., 2022; Wegman et al., 2017).
The growing global motorcycle market is driven by factors such as increasing demand for affordable and efficient mobility options, especially in urbanised areas (World Health Organization, 2022). PTWs offer essential family transport options and livelihood opportunities (e.g., motorcycle taxis) in many LMICs. It is expected that the popularity of electric motorcycles will further accelerate, particularly in sub-Saharan Africa, although Asia remains the dominant market in motorcycle sales (Bezabeh et al., 2022; Smith et al., 2025). The most recent global status report reported that more than half of all road fatalities are among those most vulnerable on the road – pedestrians, motorcyclists and cyclists (World Health Organization, 2023). As such, the increasing trends in motorisation, especially in PTW and the importation of substandard quality vehicles, offers an increasing and alarming challenge for road safety . (WHO, 2022).
As documented and monitored in the global road safety status reports, not all countries are at the same point on the continuum of creating a safe road system. For example, laws pertaining to managing behavioural risk factors (e.g., restraint and helmet use, speeding, impaired and distracted driving) are not consistent across countries or regions. The most recent global status report (WHOWorld Health Organization, 2023) reported that while 140 countries had legislation meeting WHO best practice for at least one of the five key behavourial risk factors (speeding, drink driving, motorcycle helmet use, and use of seat belts and child restraint systems), only seven countries had best practice legislation addressing all five.
Similarly, vehicle safety standards and standards for safety products, such as child restraints and helmets, are not always present or well implemented (Global NCAP, 2015; Griffiths et al., 2021; Smith et al., 2025). The WHO (2023) reported that 79 countries had no vehicle safety legislation and that only 35 countries had laws mandating all five core areas of vehicle safety equipment. The same can be said for issues relating to road design and construction, vehicle maintenance, driver licensing, law enforcement, emergency response and general health facilities (World Health Organization, 2023). Reluctance to prioritise road safety at the highest level, coupled with the slow uptake of evidence-based road safety laws, policies and practices, creates the situation in many countries where people unnecessarily suffer the harmful consequences of preventable road trauma.
The body of evidence about what improves road safety outcomes across the many related disciplines and professions is large and growing. Answers to many of the challenges to preventing road crashes already exist (e.g., Global Road Safety Facility, 2022; World Health Organization, 2017). Yet in many instances, there is a lack of will by decision makers to establish appropriate laws and policies. In part, this may be due to the lack of prioritisation of road safety at the highest level until the 21st century. The need for senior leaders to act is evidenced by continued urging by the global road safety community through avenues including global ministerial conferences on road safety and associated declarations, UN global road safety resolutions, and UN Decades of Action for Road Safety. The previous chapter provided an outline and timeline of the development of these global initiatives.
Road safety as a global development issue
As described in the preceding chapter on the history of road safety developments, awareness of the need to reduce the harm caused by road crashes has evolved over many decades. The attention given to this issue by governments has varied and, as noted above, the global road safety community continues to urge action at the highest level.
The global community’s response to improving road safety
During the 21st century, road safety outcomes have been increasingly framed in terms of development and sustainability issues. At the turn of the century, the global community focussed its development efforts on widescale poverty reduction through the UN adoption of the Millenium Development Goals. Contained within the eight goals was the desire by world leaders in 2000 to “spare no effort to free our fellow men, women and children from the abject and dehumanizing conditions of extreme poverty” (United Nations, 2015a, p.2). For fifteen years, efforts were centred around poverty reduction, universal primary education, gender equality and empowerment of women, reduced child mortality, improved mental health, combatting HIV, malaria and other diseases, environmental sustainability, and creating global partnerships to enhance development.
As that fifteen-year period ended, attention turned to furthering the global development effort. In 2015, an expanded, ambitious development plan was announced: Transforming our world: The 2030 Agenda for Sustainable Development (United Nations, 2015b). This agenda contains 17 Sustainable Development Goals (SDGs) and 169 targets and highlights a broad range of areas that require urgent attention to ‘shift the world onto a sustainable and resilient path’ (p.3), focussed around the core principles of: people, planet, prosperity, peace and partnership.
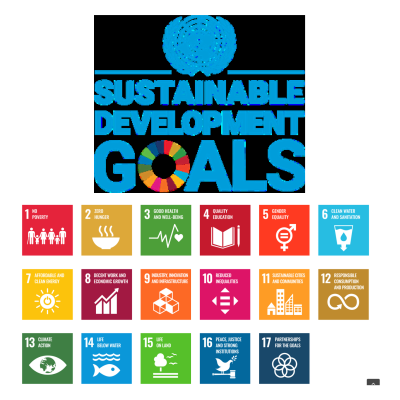
The goals are interlinked; improvements in one can assist with improvements in others. Importantly, for the first time, road safety was explicitly mentioned in the global development agenda and appears in two of the 17 goals:
- Goal 3.6: By 2020*, halve the number of global deaths and injuries from road traffic accidents.
- Goal 11.2: By 2030, provide access to safe, affordable, accessible and sustainable transport systems for all, improving road safety, notably by expanding public transport.
*Note that when the goals were developed in 2015, the timeline for achieving Goal 3.6 was 2020. In keeping with other timeframes contained in the development agenda, that goal now has a revised 2030 timeline.
This collective recognition of the need to reduce road trauma and the need to provide appropriate transport options offers opportunities for renewed impetus for action by all countries. Goal 17 encourages strong international partnerships and collaborations to ensure that the SDGs are met. These collaborations and partnerships include significant financial and capacity building contributions by philanthropic funders (e.g., Bloomberg Philanthropies, FIA Foundation, Fondation Botnar) and the United Nations Road Safety Fund (UNRSF) that was launched in 2018. The UNRSF channels financial contributions towards scalable projects that extend their influence beyond borders, aiming to create safer roads and save lives regionally and globally. It targets low-and middle-income countries, with a focus on legislative gaps and domestic funding for road safety.
Other important contributions to advance global road safety are made through multilateral development banks. Established in 2009, the Multilateral Development Banks’ Road Safety Working Group consists of 10 member institutions that support LMICs in their road safety financing needs. This working group works to harmonise investments in road safety, adopt common approaches among its members, and scale up financing in order to maximise impact (Global Road Safety Facility, 2025).
Access to data is essential to of track progress against road safety goals and targets. Reliable data collection, management and use requires sustained investment as well as appropriately skilled personnel to enable data to inform road safety interventions and monitor their outcomes. At the global level, monitoring key road safety performance indicators is necessary to determine progress on the 2030 Agenda for Sustainable Development. Road Safety Observatories (RSO) play an important role in this regard. A network of regional RSOs serves as a global forum on improving road safety data, policies and practices and promotes collaboration between the various observatories including from Africa (ARSO), Europe (ERSO), Ibero-America (OISEVI), Asia and Pacific (APRSO), Western Balkans (WBRSO), Arab Integrated (AIRSO) and Eastern Partnership (EaPRSO). This regional approach is viewed as a mechanism to provide economies of scale and an opportunity for joint efforts to improve road safety data collection and develop data-related evidence-based policies and practices in the implementation of the SDGs.
Ongoing challenges
The final part of this chapter discusses some of the challenges associate with sustained road safety improvements. As already discussed, there is a history of insufficient emphasis and attention by governments of many countries, despite the specific inclusion of road safety in the global development agenda since 2015. The lack of priority given to addressing road safety improvements, including in countries where it has previously been a priority issue, represents a key challenge for all road safety professionals and all communities (Hyder et al., 2022). Finding ways to keep road safety on the agenda is a role for all practitioners, policy makers, non-government organisations, and citizens.
Funding is another significant challenge to sustainable road safety improvements. This challenge is linked to the lack of government priority discussed above and the subsequent underinvestment in road safety (FIA Foundation, 2025). Substantial investments are needed to reach the 2030 targets. In many countries, a reliance on philanthropic funding and the failure of governments to integrate road safety investment into existing road and traffic management budgets, as well as into enforcement mechanisms has led to insufficient financial resourcing (Global Road Safety Facility, 2025). More catalytic financing that seeks to multiply investment impact by encouraging additional investment, and in particular, investment to create positive social and environmental impacts is needed (McInerney et al., 2024; Silverman et al., 2024). Private sector investment has played an important role in financing road safety, but more can be done. There is opportunity to create links between private sector financing and the development agenda to capitalise on the momentum within the sustainable finance movement and create synergies between road safety, sustainable mobility options, and climate outcomes (FIA Foundation, 2025; World Bank, 2022).
Another challenge impeding progress are the many widely held misperceptions about the benefits of improving road safety outcomes. One example is the belief that road crashes are ‘the inevitable collateral damage arising from economic development’ (Watson, 2016, p.4). This misperception might contribute to the lack of governmental priority and funding seen in many countries. Another widely held misperception relates to the desire to manage speeds across the road network which can be misunderstood as a mechanism that will drastically increase travel times and create detrimental economic impacts. The Global Road Safety Facility created an online resource to provide evidence to refute many of these widely held myths and misperceptions, particularly those relating to managing speeds (Speed Management Hub: https://www.globalroadsafetyfacility.org/news/new-explainer-video-speed-management-myths). Beliefs and misperceptions such as those outlined above can be difficult to overcome and require evidence to support alternative views. Evidence-based interventions with solid evaluation outcomes can assist in meeting this challenge.
The body of evidence, to date, has largely been generated by research conducted in HICs. This situation presents the final challenge discussed in this chapter – the need to build research capacity in LMICs and then translate that capacity into quality research outputs to guide improvements (Hyder et al., 2022). This could provide insights and solutions associated with factors influencing safety outcomes that are specific to the LMIC context. For instance, in HICs:
“there has been a long history of responding to the road safety problem that has impacted on institutional arrangements, road user behaviour and the culture of road use. However, the lessons learned and good practice from high-income countries will not necessarily transfer easily or automatically to low- and middle-income countries, due to the different cultural, institutional and social conditions existing in those countries… the type of traffic, the mix of road users, and the kinds of road crashes that occur in low- and middle-income countries differ significantly from those in high-income countries. The uneven socio-economic landscapes mean technologies and policies cannot be applied without adaptation.” (Watson, 2016, p.6).